In today’s fast-paced digital world, real-time dashboards have become an essential tool for monitoring, analyzing, and visualizing data as it happens. These dashboards allow businesses to make informed decisions quickly, respond to changes in the environment, and improve overall efficiency. In this article, we will explore the process of building a real-time dashboard, covering everything from the foundational concepts to the implementation details.
Table of Contents
- Introduction to Real-Time Dashboards
- Key Components of a Real-Time Dashboard
- Choosing the Right Technologies
- Designing the Dashboard Layout
- Setting Up the Backend
- Implementing Real-Time Data Fetching
- Building the Frontend
- Adding Data Visualizations
- Ensuring Scalability and Performance
- Testing and Deployment
- Conclusion
1. Introduction to Real-Time Dashboards
A real-time dashboard is a data visualization tool that displays current data from various sources in an interactive and intuitive manner. These dashboards are widely used in different sectors, including finance, healthcare, marketing, and IT, to monitor live data and track key performance indicators (KPIs).
Unlike traditional dashboards, which update data at set intervals, real-time dashboards continuously update information as new data becomes available. This capability is crucial for applications where timely decision-making is critical, such as monitoring system performance, tracking sales, or observing social media trends.
2. Key Components of a Real-Time Dashboard
To build a functional real-time dashboard, you need to integrate several key components:
- Data Sources: The origin of the data you want to display, which could be databases, APIs, IoT devices, etc.
- Backend: The server-side part of the application that processes data, performs computations, and serves data to the frontend.
- Frontend: The client-side part of the application that presents the data visually to the user.
- Data Processing and Storage: Mechanisms to store, process, and retrieve data efficiently.
- Real-Time Data Fetching: Techniques to ensure data is fetched and updated in real-time, such as WebSockets or server-sent events.
3. Choosing the Right Technologies
Choosing the right technologies is crucial for building a robust and scalable real-time dashboard. Here are some popular choices for each component:
- Frontend: React.js, Vue.js, Angular.js
- Backend: Node.js, Django, Flask
- Database: MongoDB, PostgreSQL, Redis
- Real-Time Communication: WebSockets, Server-Sent Events (SSE), MQTT
- Data Visualization: D3.js, Chart.js, Plotly
For this article, we will use a tech stack consisting of React.js for the frontend, Node.js for the backend, MongoDB for the database, and WebSockets for real-time communication.
4. Designing the Dashboard Layout
Before diving into the code, it’s essential to design the layout of your dashboard. The layout should be intuitive and user-friendly, ensuring that the most critical information is easily accessible.
Wireframing
Start by creating a wireframe of your dashboard. Tools like Figma, Sketch, or even pen and paper can help you outline the structure. Identify the key elements you want to display, such as charts, tables, and KPIs.
UI/UX Considerations
- Clarity: Ensure that the data is presented clearly, avoiding clutter and unnecessary elements.
- Responsiveness: Design the dashboard to be responsive, so it works well on different devices and screen sizes.
- Interactivity: Incorporate interactive elements, such as filters and drill-down capabilities, to enhance user experience.
5. Setting Up the Backend
The backend is responsible for fetching data from various sources, processing it, and providing it to the frontend. For this article, we will use Node.js and Express to set up the backend.
Step 1: Initialize the Project
Create a new directory for your project and initialize a Node.js project:
mkdir real-time-dashboard
cd real-time-dashboard
npm init -y
Step 2: Install Dependencies
Install the necessary dependencies:
npm install express mongoose socket.io cors- Express: A web framework for Node.js.
- Mongoose: An ODM (Object Data Modeling) library for MongoDB.
- Socket.io: A library for real-time web applications.
- Cors: A middleware for enabling CORS (Cross-Origin Resource Sharing).
Step 3: Set Up Express Server
Create an index.js file and set up the basic Express server:
const express = require('express');
const mongoose = require('mongoose');
const http = require('http');
const socketIo = require('socket.io');
const cors = require('cors');

const app = express();
const server = http.createServer(app);
const io = socketIo(server);

app.use(cors());
app.use(express.json());

const PORT = process.env.PORT || 5000;

mongoose.connect('mongodb://localhost:27017/dashboard', {
  useNewUrlParser: true,
  useUnifiedTopology: true,
});

const db = mongoose.connection;
db.on('error', console.error.bind(console, 'connection error:'));
db.once('open', () => {
  console.log('Connected to MongoDB');
});

io.on('connection', (socket) => {
  console.log('New client connected');

  socket.on('disconnect', () => {
    console.log('Client disconnected');
  });
});

server.listen(PORT, () => {
  console.log(`Server running on port ${PORT}`);
});
Step 4: Define Data Models
Define the data models for your application using Mongoose. For instance, create a models directory and add a file Data.js:
const mongoose = require('mongoose');

const DataSchema = new mongoose.Schema({
  value: Number,
  timestamp: {
    type: Date,
    default: Date.now,
  },
});

module.exports = mongoose.model('Data', DataSchema);
6. Implementing Real-Time Data Fetching
With the backend set up, we need to implement real-time data fetching using WebSockets. This will allow the frontend to receive data updates instantly.
Step 1: Emit Data from Server
Modify the Express server to emit data to connected clients. Update the index.js file:
const Data = require('./models/Data');

io.on('connection', (socket) => {
  console.log('New client connected');

  const sendData = async () => {
    const data = await Data.find().sort({ timestamp: -1 }).limit(1);
    socket.emit('FromAPI', data);
  };

  const interval = setInterval(() => {
    sendData();
  }, 1000);

  socket.on('disconnect', () => {
    clearInterval(interval);
    console.log('Client disconnected');
  });
});
Step 2: Fetch and Store Data
Create a function to fetch data from an external source and store it in the database. For example, create a fetchData.js file:
const axios = require('axios');
const Data = require('./models/Data');

const fetchData = async () => {
  try {
    const response = await axios.get('https://api.example.com/data');
    const newData = new Data({ value: response.data.value });
    await newData.save();
  } catch (error) {
    console.error('Error fetching data:', error);
  }
};

setInterval(fetchData, 1000);
Include this file in your index.js to start fetching data when the server starts:
require('./fetchData');7. Building the Frontend
With the backend in place, let’s build the frontend using React.js.
Step 1: Create React App
Create a new React application:
npx create-react-app real-time-dashboard-client
cd real-time-dashboard-client
Step 2: Install Dependencies
Install the necessary dependencies:
npm install socket.io-clientStep 3: Set Up WebSocket Connection
Create a services directory and add a file socket.js:
import io from 'socket.io-client';
const socket = io('http://localhost:5000');
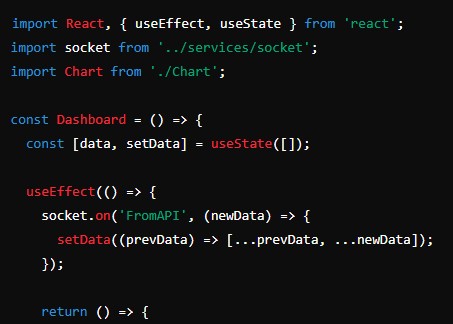
export default socket;Step 4: Create Dashboard Component
Create a components directory and add a file Dashboard.js:
import React, { useEffect, useState } from 'react';
import socket from '../services/socket';

const Dashboard = () => {
  const [data, setData] = useState([]);

  useEffect(() => {
    socket.on('FromAPI', (newData) => {
      setData((prevData) => [...prevData, ...newData]);
    });

    return () => {
      socket.off('FromAPI');
    };
  }, []);

  return (
    <div>
      <h1>Real-Time Dashboard</h1>
      <ul>
        {data.map((item) => (
          <li key={item._id}>{item.value} at {new Date(item.timestamp).toLocaleTimeString()}</li>
        ))}
      </ul>
    </div>
  );
};

export default Dashboard;
Step 5: Add Dashboard to App
Update the App.js file to include the Dashboard component:
import React from 'react';
import Dashboard from './components/Dashboard';

function App() {
  return (
    <div className="App">
      <Dashboard />
    </div>
  );
}

export default App;
8. Adding Data Visualizations
To make the dashboard more insightful, let’s add data visualizations using Chart.js.
Step 1: Install
Chart.js
Install Chart.js and its React wrapper:
npm install chart.js react-chartjs-2Step 2: Create Chart Component
Create a Chart.js file in the components directory:
import React from 'react';
import { Line } from 'react-chartjs-2';

const Chart = ({ data }) => {
  const chartData = {
    labels: data.map((item) => new Date(item.timestamp).toLocaleTimeString()),
    datasets: [
      {
        label: 'Value',
        data: data.map((item) => item.value),
        fill: false,
        backgroundColor: 'blue',
        borderColor: 'blue',
      },
    ],
  };

  return <Line data={chartData} />;
};

export default Chart;
Step 3: Integrate Chart in Dashboard
Update the Dashboard.js file to include the Chart component:
import React, { useEffect, useState } from 'react';
import socket from '../services/socket';
import Chart from './Chart';

const Dashboard = () => {
  const [data, setData] = useState([]);

  useEffect(() => {
    socket.on('FromAPI', (newData) => {
      setData((prevData) => [...prevData, ...newData]);
    });

    return () => {
      socket.off('FromAPI');
    };
  }, []);

  return (
    <div>
      <h1>Real-Time Dashboard</h1>
      <Chart data={data} />
      <ul>
        {data.map((item) => (
          <li key={item._id}>{item.value} at {new Date(item.timestamp).toLocaleTimeString()}</li>
        ))}
      </ul>
    </div>
  );
};

export default Dashboard;
9. Ensuring Scalability and Performance
When building real-time applications, it’s crucial to ensure scalability and performance. Here are some tips:
- Optimize Data Fetching: Use efficient data fetching techniques to minimize load on the server.
- Cache Data: Implement caching mechanisms to reduce database queries.
- Load Balancing: Use load balancers to distribute traffic across multiple servers.
- Monitor Performance: Continuously monitor the performance of your application and make necessary optimizations.
10. Testing and Deployment
Testing
Before deploying your real-time dashboard, thoroughly test it to ensure everything works as expected. Test different scenarios, including high traffic loads and various data sources.
Deployment
Deploying a real-time dashboard involves setting up your server, database, and frontend on a hosting platform. Some popular options include AWS, Heroku, and DigitalOcean.
11. Conclusion
Building a real-time dashboard involves integrating multiple technologies to fetch, process, and visualize data as it happens. By following the steps outlined in this article, you can create a functional real-time dashboard that helps you monitor and analyze data efficiently.
Remember to choose the right technologies, design an intuitive layout, and ensure scalability and performance. With a well-built real-time dashboard, you can make data-driven decisions and respond to changes in your environment promptly. Happy coding!